Market Intelligence

Insights from the Blue Economy

Data, analysis and perspectives on African seafood supply chains, fisheries, and maritime trade.
Latest Insights
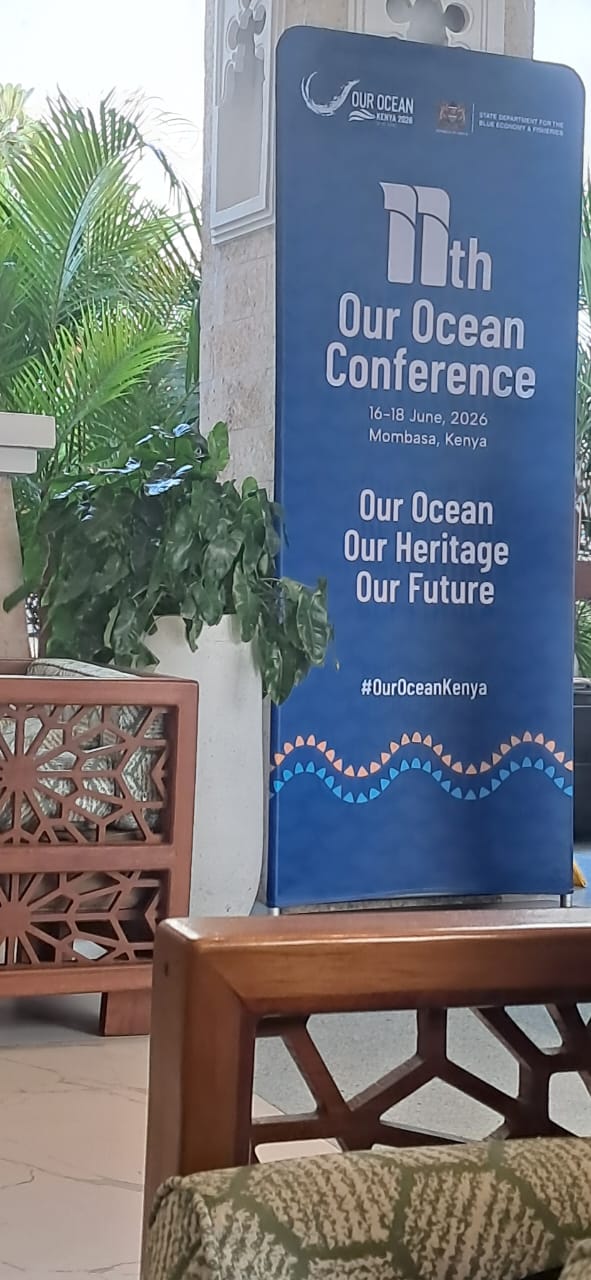
OOC11 Conference
OOC11: What the Industry Told Us
Key takeaways from the Our Ocean Conference — what processors, exporters and BMUs said about digital infrastructure in African fisheries.
BMU Landing Data
What BMU Landing Data Reveals About Kwale Fisheries
An analysis of 2024–2025 Kibuyuni BMU catch records — top species, price trends, and seasonal patterns that procurement teams need to know.
Seafood Infrastructure
Why African Seafood Needs Infrastructure, Not Just Apps
The difference between a marketplace and supply chain infrastructure — and why that distinction matters for fishers, processors and investors.
Fisher Cluster Model
The Fisher Cluster Model — Scaling Inclusion Without Losing Control
How organizing fishers into verified clusters of 5–20 creates predictable supply, easier compliance, and a pathway to group financing.
Traceability and Certification
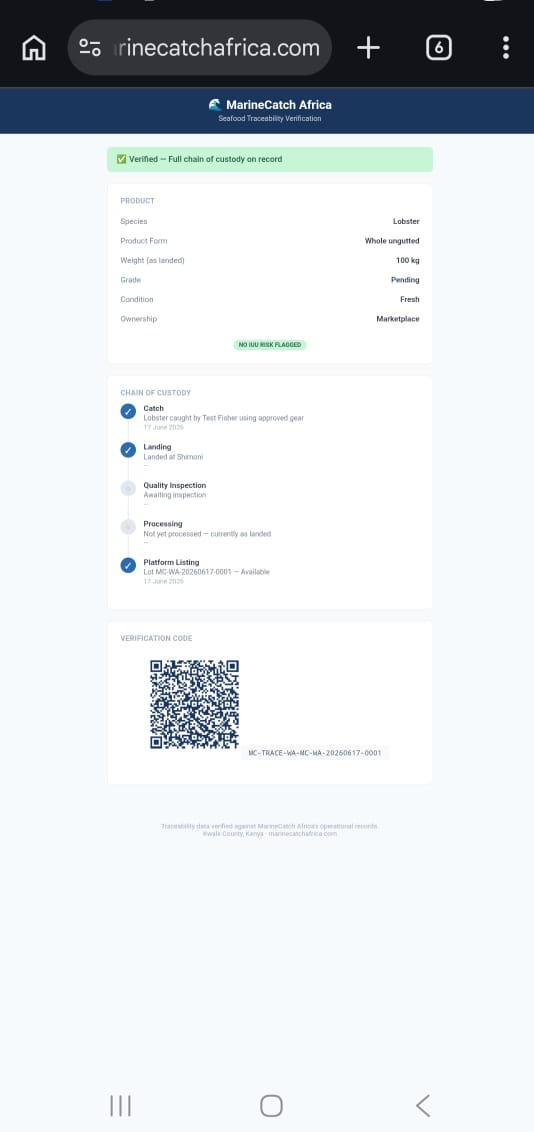
From Catch to Certification: How Digital Traceability Is Reshaping Eco-Labelling for African Fishers
How digital catch documentation changes market access for Kenyan seafood exporters and what the EU IUU regulation requires.
Blue Economy Opportunity
The Blue Economy Opportunity in Sub-Saharan Africa
Africa's coastline represents one of the world's most underutilized economic assets. Here's what digital infrastructure can unlock.
Financial Inclusion and Usability
Access Is Not the Problem. Usability Is.
Why financial inclusion for Africa's small-scale fishers requires embedded design, not more products — and what that means for seafood supply chains.

📊 Kibuyuni Fisheries Intelligence — 2025 Data

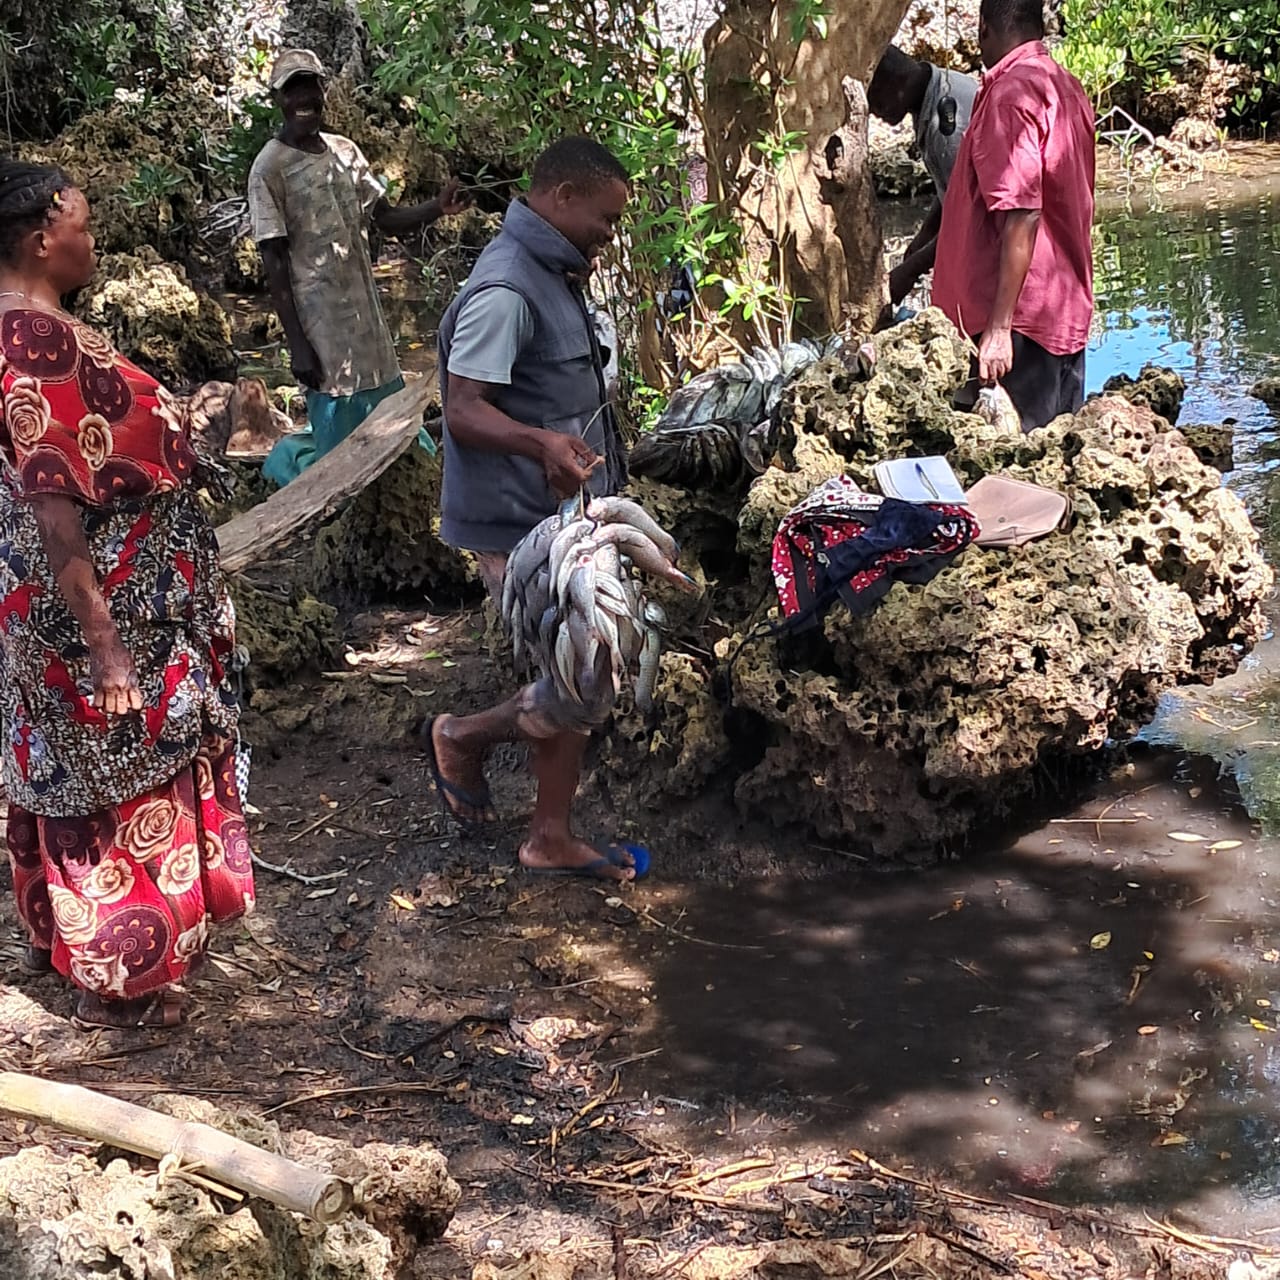
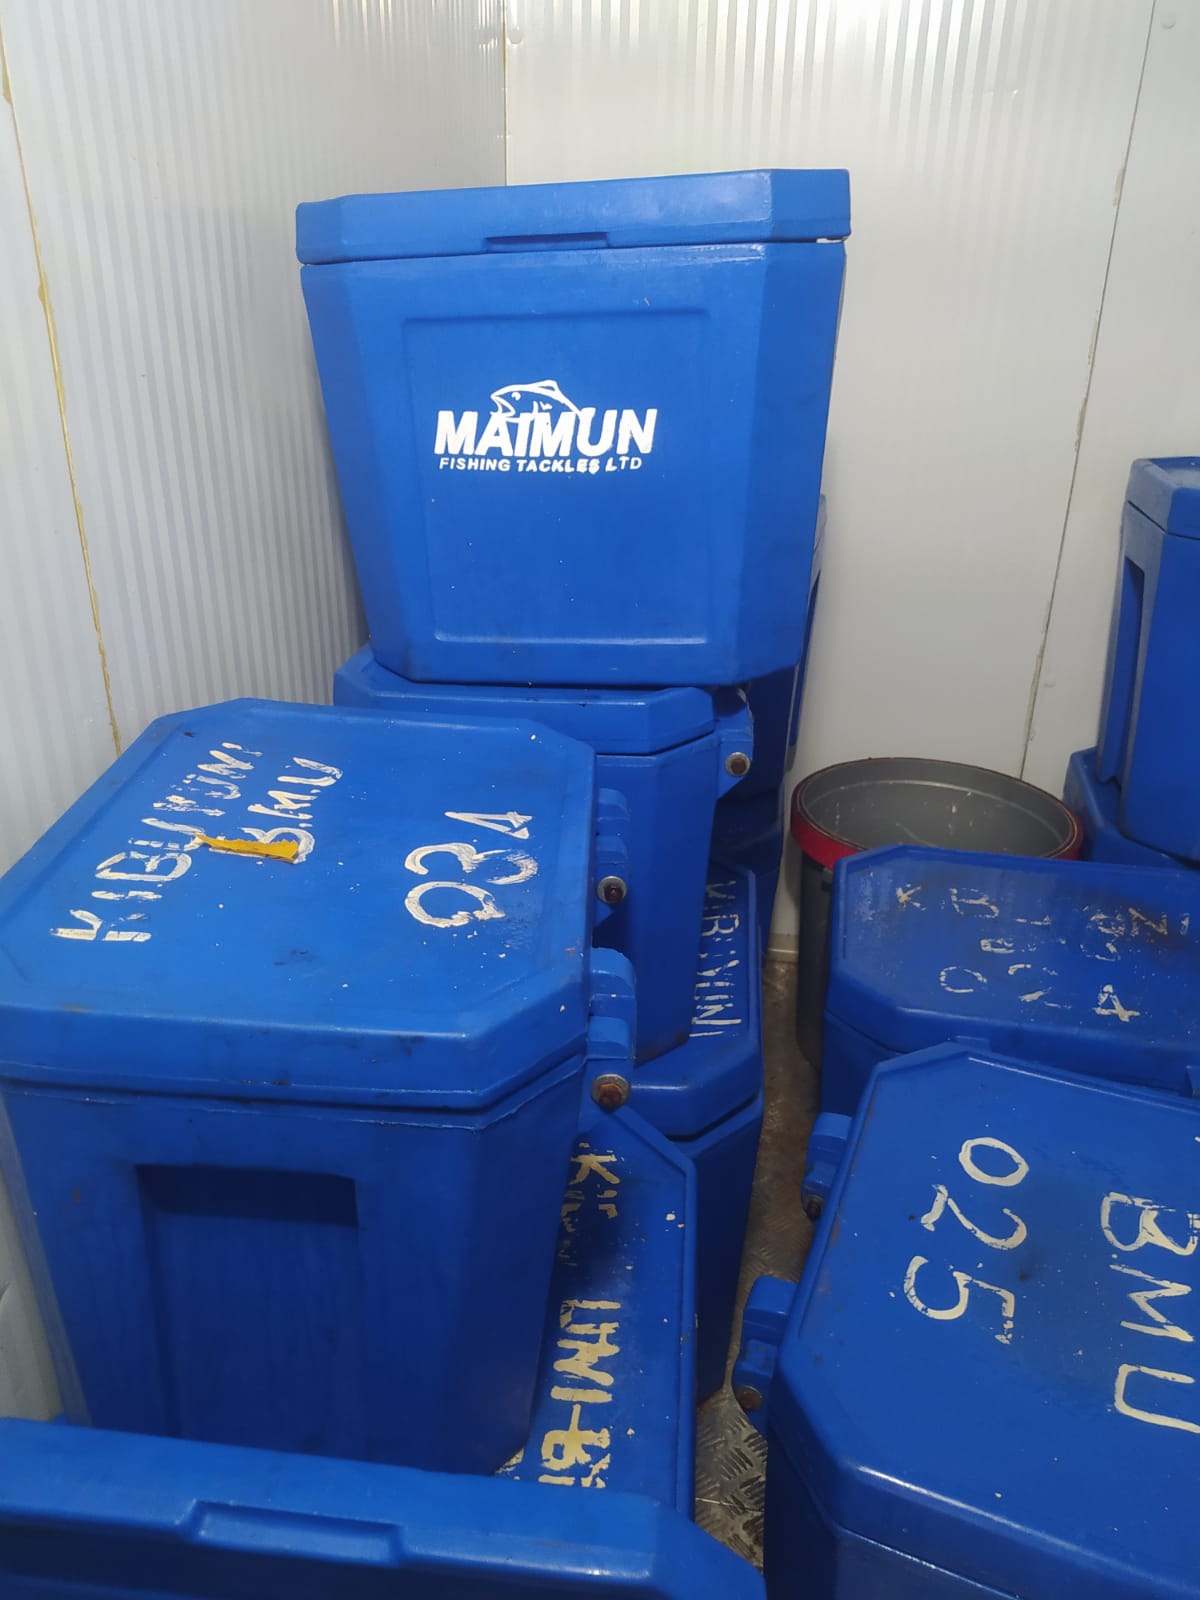
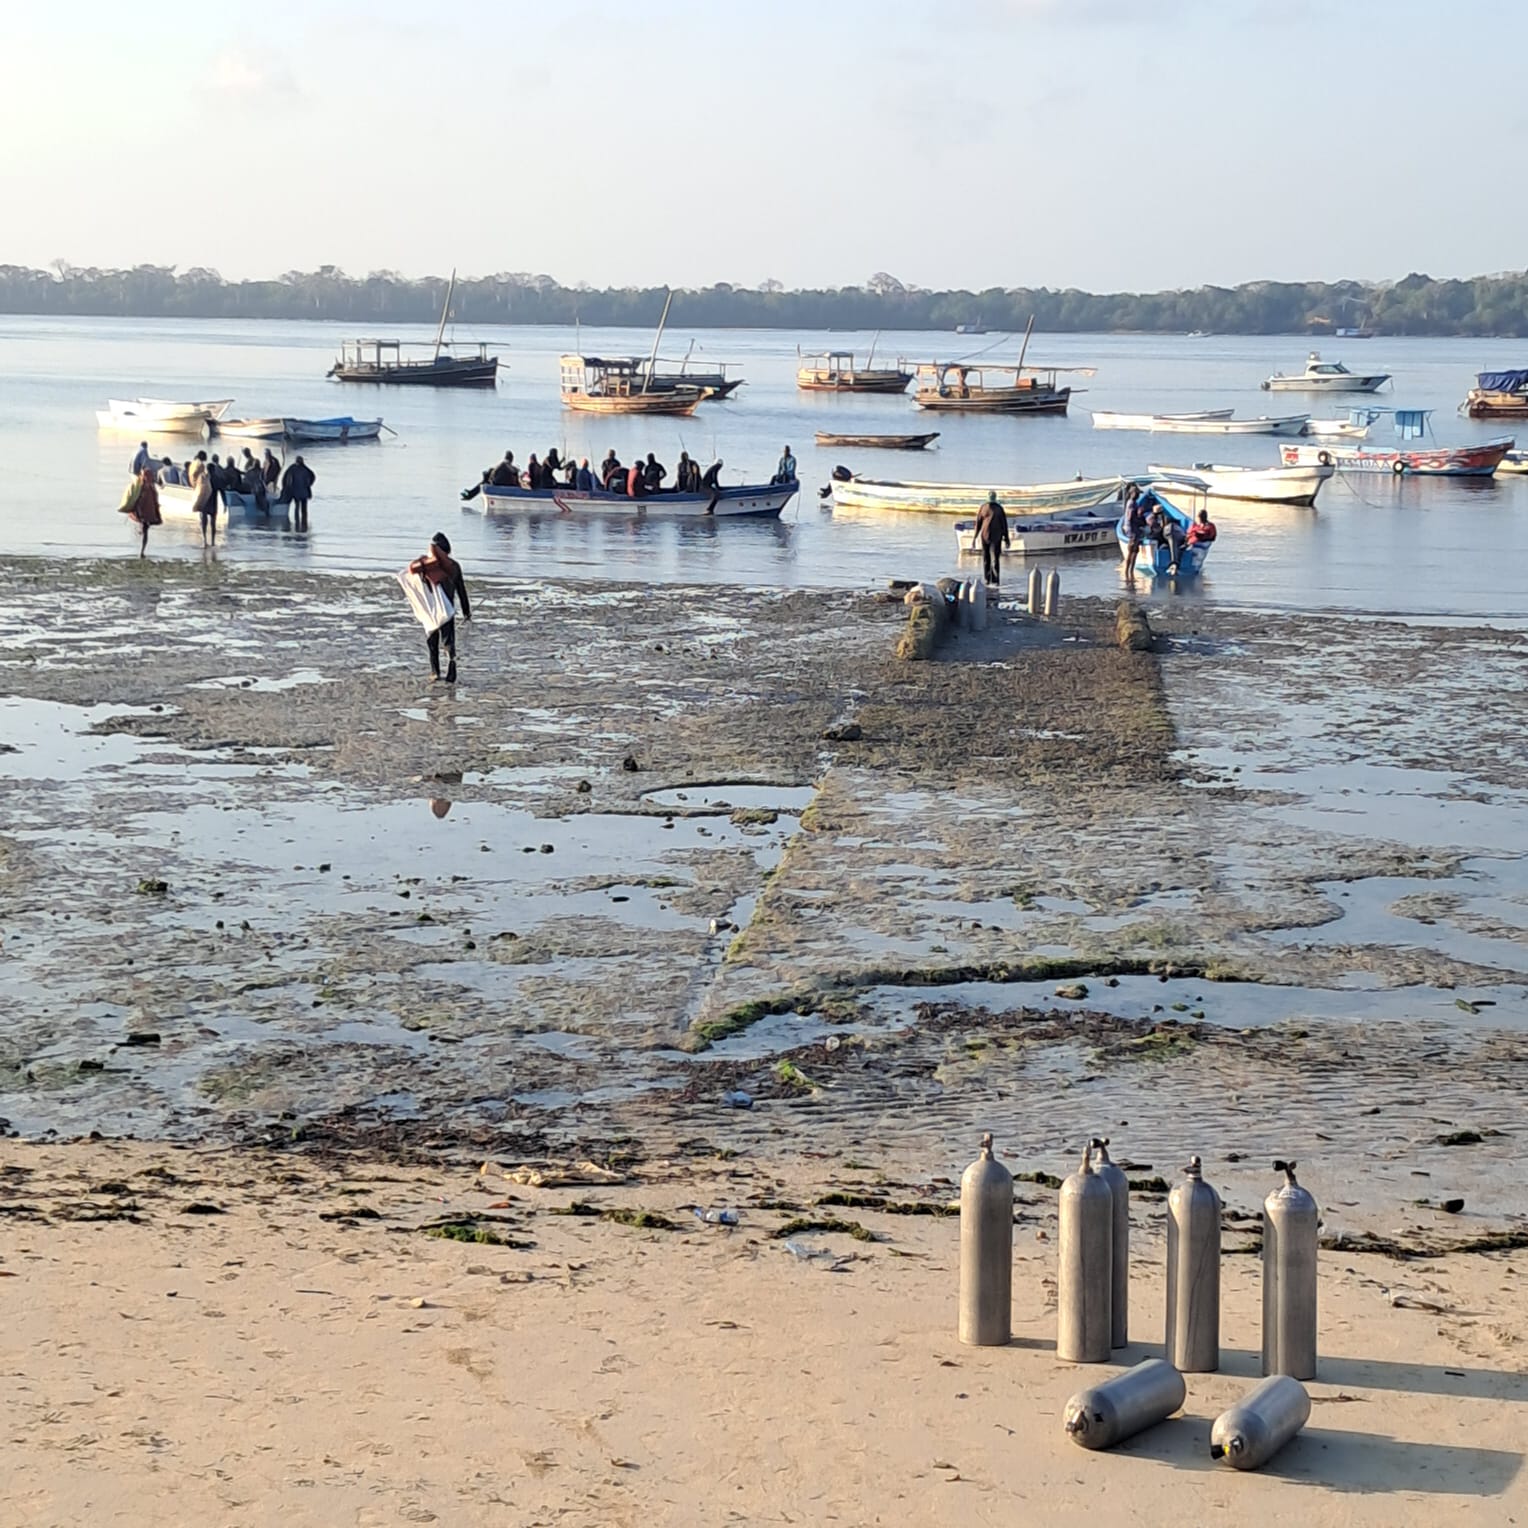
MarineCatch Africa works with Kibuyuni Beach Management Unit to digitize landing records collected for Kenya Fisheries Service. This data powers our procurement planning, price intelligence, and supply forecasting. Data used with BMU permission for market analytics.

34
Landing Records
19
Species Tracked
52,600kg
Total Volume 2025
50,000+kg
Annual Volume Range
KES 10M+
Estimated Landing Value
Q3–Q4
Peak Season
Key Findings — Kwale Coastal Fisheries
Demersal species dominate by volume~75% of catch
Pelagic species peak Q3–Q4Sep–Oct peak
High-value crustaceansLobster, Prawns
Average landing price rangeKES 80–2,500/kg
Price premium for Grade A20–35% above average
Data collected in partnership with BMU stakeholdersKwale County

Data collected in partnership with BMU stakeholders in Kwale County, Kenya, 2024–2025. Used with permission for market intelligence purposes. Raw data belongs to Kenya Fisheries Service.